


Photo by Kate Trysh on Unsplash
Building Your First Clickstream Analytics Dashboard: An End-to-End Guide


The article you are about to read was originally published on GlassFlow Blog. GlassFlow provides serverless and production-ready streaming data pipelines setup for the data team.
Venturing into the world of data pipelines may feel daunting, especially when juggling several advanced technologies. Work with us as we create an analytics dashboard tailored for clickstream data, leveraging Python's Streamline, Apache Kafka, and Apache Pinot. Even if you're new to data pipelines, this comprehensive guide is here to help.
Overview - Build your first clickstream dashboard
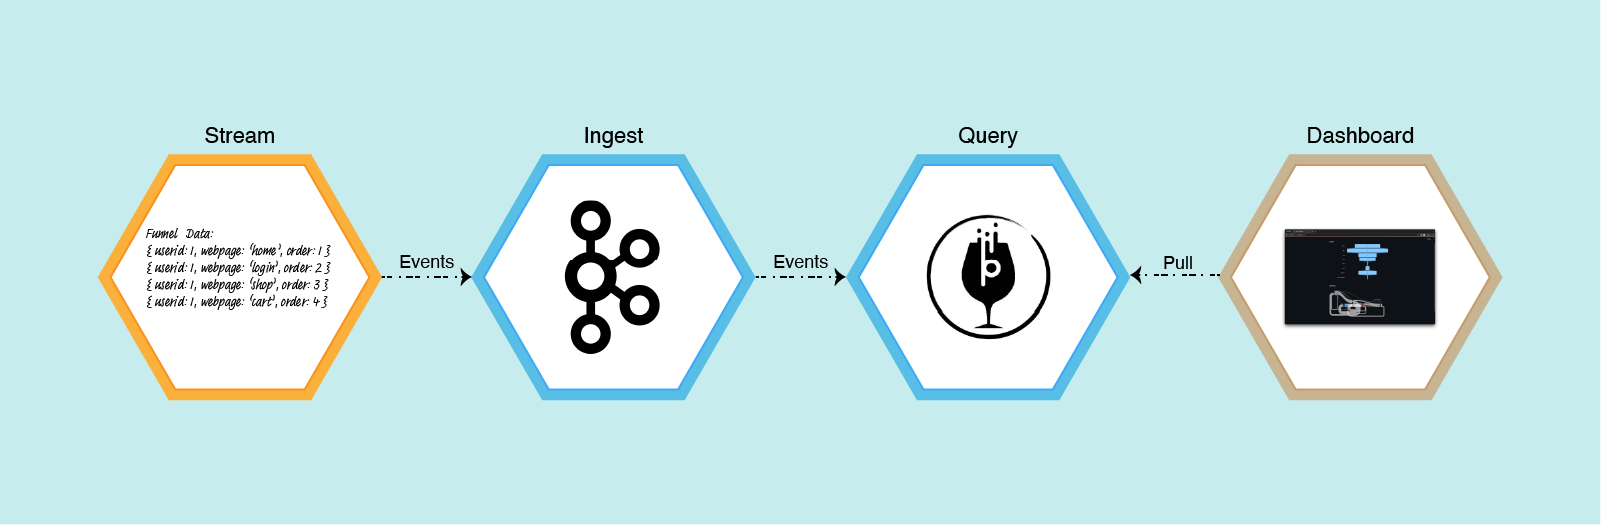
By the end of this project, we will have built a simple dashboard that shows a funnel and Sankey chart. There are four components that we need to work on. First, we need to set up Apache Kafka and Pinot. Then, we will create some data to stream to our Kafka. Finally, we need to create a dashboard that visualizes the data we get from Pinot.
Tools I Used
Apache Kafka. Apache Kafka is a distributed streaming platform that is used for building real-time data pipelines and streaming apps.
Apache Pinot. Apache Pinot is an open-source, distributed data system designed for real-time analytics and suited for time series databases, OLAP queries, and real-time monitoring systems.
Streamlit. Streamlit is an open-source Python library that allows developers to create dashboards featuring visualizations, widgets, and more.
Plotly. Plotly is an open-source graphing library. We will use this to create the funnel and Sankey chart.
Clickstream Data
Clickstream data is the information collected when a user uses a web browser. Clickstream analytics is the process of tracking, analyzing, and reporting data on the pages a user visits and user behavior while on a webpage. This data can reveal much about user behavior, including how they found the product or service and their actions while using it.
The data for the project looks like this
| User | Page They Visited | When They Visited | Location | Returning Visit |
| User 1 | Home Page | A timestamp | User location | 1 |
To make it easy to process, we turn the timestamp (When They Visited column) into order. Essentially, we sort the timestamp and assign an integer from smallest to largest.
In the real world, the data is sent as the user navigates through the website. But in this project, we will read the data from a CSV file and send its content row by row. The data looks like the following.
user_id,web_page,order,location,visit
1,home,1,Colorado,1
1,login,2,Colorado,1
1,shop,3,Colorado,1
1,cart,4,Colorado,1
1,checkout,5,Colorado,1
2,home,1,California,1
2,login,2,California,1
2,shop,3,California,1
2,cart,4,California,1
2,checkout,5,California,1
You can also use Python random library or any mock tools (for example, Mockaroo) to generate this kind of data.
Setting Up Kafka and Pinot
Next, we need to set up Kafka and Pinot. However, manually setting up such complex systems can be daunting, even for experienced developers. You have to deal with complex dependencies, for example, using Zookeeper to manage distributed systems. Installing and configuring these dependencies can be time-consuming. You have to pay attention to many configurations. You need to make sure all components and their dependencies are correct. And so on.
Since the focus of this article is to give an end-to-end review of the whole system, let’s not get bogged down with a manual setup. Let’s use Docker-Compose. A side note: Docker-Compose is not meant for a production environment. It is primarily used in development because it is easy to manage multi-container applications like this project.
Docker-Compose offers a simplified approach. It will help streamline the setup process. I will provide two docker-compose files—one for Apple Silicon and the other for Intel-based machines.
Docker-Compose File for Apple Silicon
version: '3.7'
services:
  zookeeper:
    image: zookeeper:latest
    container_name: "zookeeper-clickstream"
    ports:
      - "2181:2181"
    environment:
      ZOOKEEPER_CLIENT_PORT: 2181
      ZOOKEEPER_TICK_TIME: 2000
  kafka:
    image: wurstmeister/kafka:latest
    restart: unless-stopped
    container_name: "kafka-clickstream"
    ports:
      - "9092:9092"
    expose:
      - "9093"
    depends_on:
      - zookeeper
    environment:
      KAFKA_ZOOKEEPER_CONNECT: zookeeper-clickstream:2181/kafka
      KAFKA_BROKER_ID: 0
      KAFKA_ADVERTISED_HOST_NAME: kafka-clickstream
      KAFKA_ADVERTISED_LISTENERS: PLAINTEXT://kafka-clickstream:9093,OUTSIDE://localhost:9092
      KAFKA_LISTENERS: PLAINTEXT://0.0.0.0:9093,OUTSIDE://0.0.0.0:9092
      KAFKA_LISTENER_SECURITY_PROTOCOL_MAP: PLAINTEXT:PLAINTEXT,OUTSIDE:PLAINTEXT
  pinot-controller:
    image: apachepinot/pinot:0.12.0-arm64
    command: "StartController -zkAddress zookeeper-clickstream:2181"
    container_name: "pinot-controller-clickstream"
    volumes:
      - ./config:/config
      - ./data:/data
    restart: unless-stopped
    ports:
      - "9000:9000"
    depends_on:
      - zookeeper
  pinot-broker:
    image: apachepinot/pinot:0.12.0-arm64
    command: "StartBroker -zkAddress zookeeper-clickstream:2181"
    restart: unless-stopped
    container_name: "pinot-broker-clickstream"
    volumes:
      - ./config:/config
    ports:
      - "8099:8099"
    depends_on:
      - pinot-controller
  pinot-server:
    image: apachepinot/pinot:0.12.0-arm64
    command: "StartServer -zkAddress zookeeper-clickstream:2181"
    restart: unless-stopped
    container_name: "pinot-server-clickstream"
    volumes:
      - ./config:/config
    ports:
      - "8098:8098"
      - "8097:8097"
    depends_on:
      - pinot-broker
Docker-Compose File for x86
version: '3.7'
services:
  zookeeper:
    image: zookeeper:3.5.6
    container_name: "zookeeper-clickstream"
    ports:
      - "2181:2181"
    environment:
      ZOOKEEPER_CLIENT_PORT: 2181
      ZOOKEEPER_TICK_TIME: 2000
  kafka:
    image: wurstmeister/kafka:latest
    restart: unless-stopped
    container_name: "kafka-clickstream"
    ports:
      - "9092:9092"
    expose:
      - "9093"
    depends_on:
      - zookeeper
    environment:
      KAFKA_ZOOKEEPER_CONNECT: zookeeper-clickstream:2181/kafka
      KAFKA_BROKER_ID: 0
      KAFKA_ADVERTISED_HOST_NAME: kafka-clickstream
      KAFKA_ADVERTISED_LISTENERS: PLAINTEXT://kafka-clickstream:9093,OUTSIDE://localhost:9092
      KAFKA_LISTENERS: PLAINTEXT://0.0.0.0:9093,OUTSIDE://0.0.0.0:9092
      KAFKA_LISTENER_SECURITY_PROTOCOL_MAP: PLAINTEXT:PLAINTEXT,OUTSIDE:PLAINTEXT
  pinot-controller:
    image: apachepinot/pinot:0.12.0
    command: "StartController -zkAddress zookeeper-clickstream:2181 -dataDir /data"
    container_name: "pinot-controller-clickstream"
    volumes:
      - ./config:/config
      - ./data:/data
    restart: unless-stopped
    ports:
      - "9000:9000"
    depends_on:
      - zookeeper
  pinot-broker:
    image: apachepinot/pinot:0.12.0
    command: "StartBroker -zkAddress zookeeper-clickstream:2181"
    restart: unless-stopped
    container_name: "pinot-broker-clickstream"
    volumes:
      - ./config:/config
    ports:
      - "8099:8099"
    depends_on:
      - pinot-controller
  pinot-server:
    image: apachepinot/pinot:0.12.0
    command: "StartServer -zkAddress zookeeper-clickstream:2181"
    restart: unless-stopped
    container_name: "pinot-server-clickstream"
    volumes:
      - ./config:/config
    ports:
      - "8098:8098"
    depends_on:
      - pinot-broker
Spin Up Kafka and Pinot
Using the above docker-compose file, we can now spin both Kafka and Pinot up using the following command:
# For x86 machine
$ docker-compose up

# For Apple silicon
$ docker-compose -f docker-compose-m1.yml up
Creating Topic
Before sending a bunch of data to Kafka, we must create a “topic.” A topic in Kafka is a category or name to which records are published. Think of it like a channel on a TV. If you want to watch a particular type of show or get specific news updates, you tune into a specific channel. Similarly, in Kafka, producers send records to topics, and consumers read records from topics.
The following command will create a topic named “clickstream_events” in Kafka.
$ docker exec -it kafka-clickstream kafka-topics.sh \\
  --bootstrap-server localhost:9092 \\
  --partitions 5 \\
  --topic clickstream_events \\
  --create
Add Pinot Table
Before Pinot can work, it must know how to save the data and connect to Kafka. To allow that, we must first define a schema.json and a table.json. Then, we need to tell Pinot to create the table following our schema and definition.
The schema will follow the data definition from the previous section. There will be user_id, web_page, order, location, and visit. We also add a timestamp column named ts. This timestamp column is vital in Pinot because it determines the time boundary and manages the life cycle of data stored in Pinot segments.
schema.json
{
    "schemaName": "clickstream",
    "dimensionFieldSpecs": [
      {
        "name": "user_id",
        "dataType": "INT"
      },
      {
        "name": "web_page",
        "dataType": "STRING"
      },
      {
        "name": "order",
        "dataType": "INT"
      },
      {
        "name": "location",
        "dataType": "STRING"
      },
      {
        "name": "visit",
        "dataType": "INT"
      }
    ],
    "dateTimeFieldSpecs": [
      {
        "name": "ts",
        "dataType": "TIMESTAMP",
        "format": "1:MILLISECONDS:EPOCH",
        "granularity": "1:MILLISECONDS"
      }
    ]
  }
To connect Pinot with Kafka, we need to create a table and define the connection configuration. This is so Pinot knows where to connect, what topic to read from, and other settings.
The complete table.json content is as follows. Notice the streamConfigs section where we define the stream type (Kafka), the broker (kafka-clickstream:9093), and the topic name (clickstream-events). This is how Pinot gets the data From Kafka.
table.json
{
    "tableName": "clickstream",
    "tableType": "REALTIME",
    "segmentsConfig": {
      "timeColumnName": "ts",
      "schemaName": "clickstream",
      "replicasPerPartition": "1"
    },
    "tenants": {},
    "tableIndexConfig": {
      "streamConfigs": {
        "streamType": "kafka",
        "stream.kafka.topic.name": "clickstream-events",
        "stream.kafka.broker.list": "kafka-clickstream:9093",
        "stream.kafka.consumer.type": "lowlevel",
        "stream.kafka.consumer.prop.auto.offset.reset": "smallest",
        "stream.kafka.consumer.factory.class.name":
          "org.apache.pinot.plugin.stream.kafka20.KafkaConsumerFactory",
        "stream.kafka.decoder.class.name":
          "org.apache.pinot.plugin.stream.kafka.KafkaJSONMessageDecoder",
          "realtime.segment.flush.threshold.rows": "1000",
          "realtime.segment.flush.threshold.time": "24h",
          "realtime.segment.flush.segment.size": "100M"
      }
    },
    "metadata": {},
    "ingestionConfig": {
      "transformConfigs": [
        {
          "columnName": "user_id",
          "transformFunction": "JSONPATH(meta, '$.user_id')"
        },
        {
          "columnName": "web_page",
          "transformFunction": "JSONPATH(meta, '$.web_page')"
        },
        {
          "columnName": "order",
          "transformFunction": "JSONPATH(meta, '$.order')"
        },
        {
          "columnName": "location",
          "transformFunction": "JSONPATH(meta, '$.location')"
        },
        {
          "columnName": "visit",
          "transformFunction": "JSONPATH(meta, '$.visit')"
        },
        {
            "columnName": "ts",
            "transformFunction": "\\"timestamp\\" * 1000"
        }
      ]
    }
  }
Now that we have defined our schema and table configuration, we only need to run the following command.
$ docker exec -it pinot-controller-wiki bin/pinot-admin.sh AddTable \\
  -tableConfigFile /config/table.json \\
  -schemaFile /config/schema.json \\
  -exec
Sending Data
Once we have set up Kafka and Pinot, it is time to send some data. As mentioned before, we will read the funnel data from a CSV and send every row to Kafka. Giving some random sleep between each transmission.
Our code that sends this data to Kafka is as follows.
import json
import time
import random
import csv

from confluent_kafka import Producer

def acked(err, msg):
    if err is not None:
        print(f"Failed to deliver message: {msg.value()}: {err.str()}")

producer = Producer({'bootstrap.servers': 'localhost:9092'})

with open('funnel_steps.csv', newline='') as csvfile:
    reader = csv.DictReader(csvfile)

    for row in reader:
        print(f'Sending payload: {row}')
        # Send to Kafka
        payload = json.dumps(row)
        producer.produce(topic='clickstream-events', key=str(row['user_id']),
                         value=payload, callback=acked)

        # Random sleep
        sleep_time = random.randint(1, 4)
        time.sleep(sleep_time)
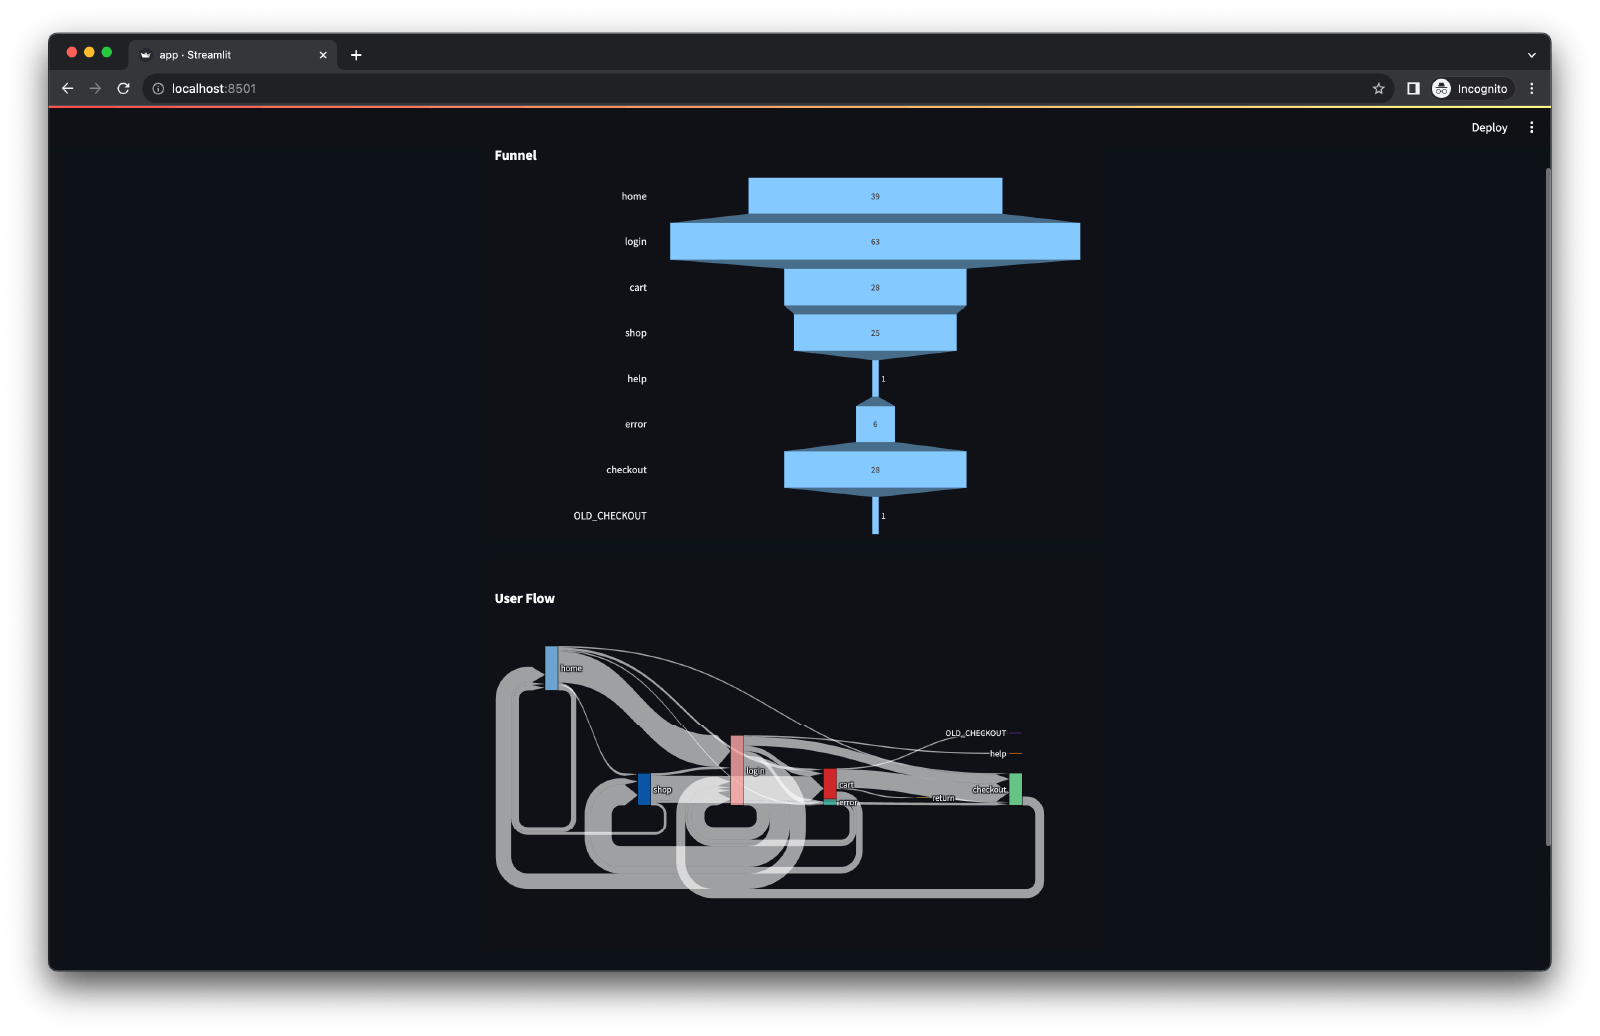
Building the Dashboard
Now that the data is sent to Kafka and Pinot, we can display our dashboard. I use this Streamlit code to show a funnel and user flow data.
import streamlit as st
import pandas as pd
import plotly.graph_objects as go
from streamlit_autorefresh import st_autorefresh
import pinotdb

def get_funnel_figure(df):
    trace = go.Funnel(
        x=df.agg('sum', numeric_only=1).values,
        y=['home', 'login', 'cart', 'shop', 'help', 'error',
           'checkout', 'OLD_CHECKOUT']
    )

    layout = go.Layout(margin={"l": 180, "r": 0, "t": 30, "b": 0, "pad": 0},
                       funnelmode="stack",
                       showlegend=False,
                       hovermode='closest',
                       title='',
                       legend=dict(orientation="v",
                                   bgcolor='#E2E2E2',
                                   xanchor='left',
                                   font=dict(size=12)))
    fig = go.Figure(trace, layout)
    fig.update_layout(title_text="Funnel", font_size=10)
    return fig

def get_sankey_figure(df):
    # Process the data to capture transitions
    all_transitions = []

    for path in df['web_page']:
        steps = path.split(',')
        transitions = list(zip(steps[:-1], steps[1:]))
        all_transitions.extend(transitions)

    transition_df = pd.DataFrame(all_transitions, columns=['source', 'target'])
    trans_count = (transition_df.groupby(['source', 'target'])
                   .size()
                   .reset_index(name='value')
                   .sort_values('value', ascending=False))

    # Create unique labels for the nodes
    unique_labels = pd.concat([trans_count['source'],
                               trans_count['target']]).unique()

    # Map the source and target strings to numeric values
    trans_count['source'] = trans_count['source'].map(
        {label: idx for idx, label in enumerate(unique_labels)})
    trans_count['target'] = trans_count['target'].map(
        {label: idx for idx, label in enumerate(unique_labels)})

    # Create the Sankey diagram
    fig = go.Figure(go.Sankey(
        node=dict(pad=15, thickness=15,
                  line=dict(color="black", width=0.5),
                  label=unique_labels),
        link=dict(arrowlen=15,
                  source=trans_count['source'],
                  target=trans_count['target'],
                  value=trans_count['value'])
    ))

    fig.update_layout(title_text="User Flow", font_size=10)
    return fig

def get_connection():
    conn = pinotdb.connect(host='localhost', port=9000,
                           path='/sql', scheme='http')
    return conn

def get_funnel_data(conn):
    query = """SELECT
                SUM(case when web_page='home' then 1 else 0 end) as home,
                SUM(case when web_page='login' then 1 else 0 end) as login,
                SUM(case when web_page='cart' then 1 else 0 end) as cart,
                SUM(case when web_page='shop' then 1 else 0 end) as shop,
                SUM(case when web_page='help' then 1 else 0 end) as help,
                SUM(case when web_page='error' then 1 else 0 end) as error,
                SUM(case when web_page='checkout' then 1 else 0 end) as checkout,
                SUM(case when web_page='OLD_CHECKOUT' then 1 else 0 end) as OLD_CHECKOUT,
                location,
                user_id
                FROM clickstream
                GROUP BY location, user_id
                LIMIT 200
            """
    df = pd.read_sql_query(query, conn)
    return df

def get_sankey_data(conn):
    df = pd.read_sql_query('SELECT * FROM clickstream LIMIT 200', conn)
    df = (df.groupby(['location', 'user_id'])['web_page']
                    .apply(lambda x: ','.join(x))
                  .reset_index())
    return df

conn = get_connection()

# update every 30 seconds
st_autorefresh(interval=30 * 1000, key="dataframerefresh")

# Funnel Chart
funnel_data = get_funnel_data(conn)
funnel_fig = get_funnel_figure(funnel_data)
st.plotly_chart(funnel_fig, use_container_width=True)

# Sankey Chart
sankey_data = get_sankey_data(conn)
sankey_fig = get_sankey_figure(sankey_data)
st.plotly_chart(sankey_fig, use_container_width=True)
Result
Once everything is set up correctly, we can see the result.
Conclusion
After building your first clickstream dashboard you might think embarking on the data pipeline journey can be intimidating. With some tools that are available right now, such as Docker, Kafka, Pinot, and Streamlit, we can make this complex task manageable. Whether you're analyzing user behaviors, optimizing sales funnels, or just experimenting, these tools offer a scalable and efficient way to handle and visualize data.
Now, you might be wondering why we should go through all this trouble. Why not just batch process the data every day or every half a day? Why use streaming when you can use batching?
Modern applications need to act fast. Often up to the millisecond fast. With the sheer volume of data being produced at every moment, it is critical to act fast on the data before it becomes stale or obsolete. This continuous data processing offers advantages that can transform the way businesses run.
As businesses and technologies grow, the paradigms of data handling and processing are shifting. Being equipped with the right tools and understanding the significance of real-time processing could be the determining factor in staying ahead in the competitive landscape.